The Complete Magento 2 Debugging Guide — Logs, Xdebug & PHP Profiling (2026)
Master the Magento 2 debugging guide: enable developer mode, read the right log files, configure Xdebug, profile with Blackfire, and resolve the 10 most common fatal errors.
This Magento 2 debugging guide covers every tool and technique a PHP developer needs to diagnose and fix issues on any Magento 2 installation — from a blank white screen to a slow checkout. The Magento 2 debugging guide starts with the correct developer mode and log configuration, moves through Xdebug setup for step-through debugging, Blackfire profiling for performance issues, and Query Monitor for database analysis. By following this Magento 2 debugging guide you will have a repeatable debugging workflow that finds the root cause of any issue in minutes rather than hours.
Effective Magento 2 debugging starts with three things: developer mode enabled so errors are displayed and exceptions are not swallowed, the correct log files being read, and OPcache cleared after every code change. Without these three fundamentals, every other tool in this Magento 2 debugging guide will give you incomplete or misleading information.
Magento 2 Debugging Guide: Enable Developer Mode First
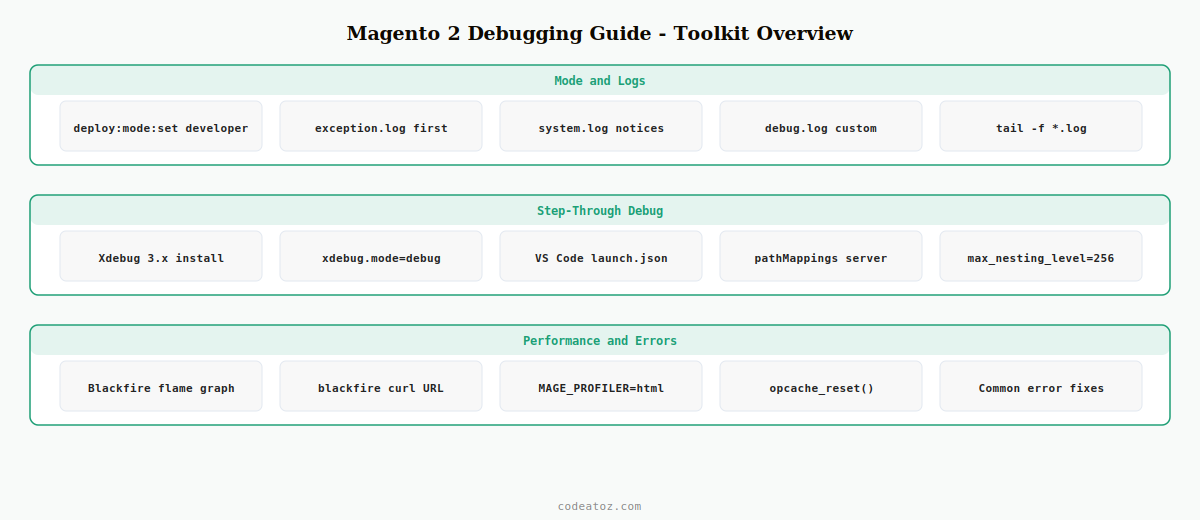
The first step in any Magento 2 debugging guide session is confirming you are in developer mode. Default mode and production mode suppress errors, redirect exceptions to log files, and use cached templates — making debugging almost impossible. Developer mode shows full stack traces, disables the full-page cache, and recompiles templates on every request.
# Enable developer mode — first step in any Magento 2 debugging guide
bin/magento deploy:mode:set developer

# Verify current mode
bin/magento deploy:mode:show

# Clear all caches after switching mode
bin/magento cache:flush

# If blank screen persists after mode switch:
chmod -R 777 var/ generated/ pub/static/
bin/magento setup:di:compile
💡 Never run developer mode in production. It exposes stack traces, disables security headers, and significantly slows page generation. Use a staging environment with a production data snapshot for this Magento 2 debugging guide workflow — never debug live issues by switching a production store to developer mode.
Magento 2 Debugging Guide: Reading the Right Log Files
Magento 2 writes different types of errors to different log files. This Magento 2 debugging guide covers the five most important logs and what each one tells you. All log files live in var/log/ relative to the Magento root.
# General application errors — start here in any Magento 2 debugging guide
tail -f var/log/system.log

# Exception stack traces — full PHP exceptions with file and line number
tail -f var/log/exception.log

# Scheduled task errors — cron job failures and timing issues
tail -f var/log/cron.log

# Custom module logs via PsrLogLoggerInterface
tail -f var/log/debug.log

# GraphQL resolver errors
tail -f var/log/graphql.log

# Live monitoring: watch all logs simultaneously
tail -f var/log/*.log
When following this Magento 2 debugging guide, always check exception.log first for a full stack trace. system.log contains lower-severity notices that often appear alongside a critical exception. To write from your own module to these logs, inject PsrLogLoggerInterface via DI and call $this->logger->error('message', ['context' => $data]).
Magento 2 Debugging Guide: Configure Xdebug for Step-Through Debugging
Xdebug is the most powerful tool in this Magento 2 debugging guide — it lets you pause execution at any line, inspect variable values, and step through call stacks. The configuration below uses Xdebug 3.x with VS Code, the most common setup for Magento 2 debugging in 2026.
; Magento 2 debugging guide: Xdebug 3.x configuration
zend_extension=xdebug

xdebug.mode=debug
xdebug.start_with_request=yes
xdebug.client_host=127.0.0.1
xdebug.client_port=9003
xdebug.log=/tmp/xdebug.log
xdebug.log_level=0

; Increase max nesting for Magento 2 debugging — Magento has deep call stacks
xdebug.max_nesting_level=256

; Increase these to avoid timeouts during Magento 2 debugging sessions
xdebug.connect_timeout_ms=2000{
"version": "0.2.0",
"configurations": [
{
"name": "Magento 2 Debugging Guide: Listen for Xdebug",
"type": "php",
"request": "launch",
"port": 9003,
"pathMappings": {
"/var/www/html/magento": "${workspaceFolder}"
}
}
]
}With this Magento 2 debugging guide Xdebug configuration, set a breakpoint in VS Code, open the store in your browser, and execution pauses at your breakpoint. You can inspect $this, local variables, and the full call stack. Essential for debugging plugin interceptors, observer callbacks, and resolver logic where var_dump() would be impractical.
Magento 2 Debugging Guide: Profile Performance with Blackfire
When the Magento 2 debugging guide problem is slow performance rather than an error, Blackfire is the tool. It profiles every function call, SQL query, and external HTTP request on a real page load and presents a flame graph showing exactly where time is spent.
# Install Blackfire PHP probe and agent
apt-get install blackfire
blackfire agent:start

# Profile a specific URL during Magento 2 debugging
blackfire curl https://your-staging-store.com/checkout/

# Profile a Magento CLI command — useful for Magento 2 debugging cron jobs
blackfire run php bin/magento indexer:reindex catalog_product_price
The Adobe Commerce testing and debugging documentation covers Magento’s built-in profiler. The Xdebug step debugging documentation covers all configuration options. The Blackfire Magento integration guide covers the full Blackfire setup for Magento 2 debugging. See our Magento 2 DI guide for how to inject LoggerInterface into your custom classes.
Magento 2 Debugging Guide: The 10 Most Common Errors and Fixes
This Magento 2 debugging guide section covers the errors you will encounter most frequently and their root causes:
- Blank white screen: OPcache serving stale bytecode after a deploy. Fix:
bin/magento cache:flushthenphp -r "opcache_reset();"or restart PHP-FPM. - Area code not set: Code running outside the Magento bootstrap context. Fix: ensure your script uses
Bootstrap::create()or runs viabin/magento. - Plugin class not found after DI compile: Namespace mismatch between
di.xmland the actual class file path. Fix: verify PSR-4 autoload registration incomposer.json. - Interceptor compilation error: Plugin targeting a method that does not exist or is not public. Fix: check the target class method signature matches the plugin’s
before/after/aroundparameter count. - Memory exhausted during indexing: PHP memory limit too low for the catalogue size. Fix: increase
memory_limitinphp.inito at least 2G for indexing operations. - Session already started warning: Third-party code calling
session_start()before Magento initialises the session. Fix: find and remove the direct session call — use Magento’sSessionManagerInterfaceinstead. - 404 on custom controller route: Module sequence or front name conflict. Fix: run
bin/magento module:statusand checketc/frontend/routes.xmlfront name uniqueness.
⚠ Never enable Magento 2 debugging tools (Xdebug, Blackfire, verbose logging) on a production server. Xdebug with start_with_request=yes blocks every PHP request waiting for a debugger connection, causing catastrophic performance degradation. Always debug on staging with a production data clone.
Magento 2 Debugging Guide: Enable Custom Logging in Your Module
For module-specific Magento 2 debugging, inject PsrLogLoggerInterface into your class and use structured log context arrays. This writes to var/log/debug.log by default and supports all PSR-3 severity levels.
<?php
use PsrLogLoggerInterface;

class MyService {
    public function __construct(
        private readonly LoggerInterface $logger
    ) {}

    public function process( int $id ): void {
        // Magento 2 debugging guide: structured context logging
        $this->logger->debug( 'Processing started', ['id' => $id] );
        try {
            // ... logic ...
            $this->logger->info( 'Processing complete', ['id' => $id, 'result' => 'ok'] );
        } catch ( Exception $e ) {
            $this->logger->error( 'Processing failed: ' . $e->getMessage(), [
                'id'        => $id,
                'exception' => $e,
            ]);
        }
    }
}
Frequently Asked Questions — Magento 2 Debugging Guide
How do I enable error display in Magento 2 for debugging?
Run bin/magento deploy:mode:set developer to enable developer mode. This displays full PHP stack traces in the browser, disables caching for templates and layout, and writes verbose output to var/log/. In developer mode you do not need to check log files for most errors — the exception is displayed directly in the browser as the first step in any Magento 2 debugging guide workflow.
Which log file should I check first in Magento 2 debugging?
Start with var/log/exception.log — it contains full stack traces for every PHP exception Magento catches. If that file is empty, check var/log/system.log for lower-severity errors. For cron-related issues in your Magento 2 debugging guide workflow, check var/log/cron.log. For GraphQL errors, check var/log/graphql.log. Use tail -f var/log/*.log to watch all files simultaneously.
How do I configure Xdebug for Magento 2 debugging?
Install Xdebug 3.x for your PHP version. Set xdebug.mode=debug, xdebug.start_with_request=yes, xdebug.client_port=9003, and xdebug.max_nesting_level=256 in php.ini. In VS Code, create a launch.json with type php, port 9003, and a pathMappings entry from your server path to the workspace folder. This Magento 2 debugging guide Xdebug setup lets you set breakpoints in any class including plugin interceptors.
Why does my Magento 2 show a blank white screen even in developer mode?
A blank white screen in developer mode usually means PHP is fataling before Magento can display its error template. Check the PHP error log (not the Magento log) — typically at /var/log/php/error.log or accessible via phpinfo(). Common causes in this Magento 2 debugging guide scenario: a syntax error in a recently edited class file, a missing or incorrectly namespaced class after DI compile, or stale OPcache bytecode. Run bin/magento setup:di:compile and flush all caches.
How do I profile slow Magento 2 pages for debugging?
Use Blackfire for PHP-level profiling — it shows a flame graph of every function call and SQL query on a real page load. For quick Magento 2 debugging guide analysis without Blackfire, enable the built-in Magento profiler by setting MAGE_PROFILER=html in .htaccess or as an environment variable. This adds a profiler table to every page showing block render times and SQL query counts per block.
How do I add custom log output in a Magento 2 module for debugging?
Inject PsrLogLoggerInterface via constructor DI in your class. Call $this->logger->debug(), info(), warning(), or error() with a message string and an optional context array. Log entries appear in var/log/debug.log. For a Magento 2 debugging guide approach to module-specific logs, create a custom logger virtual type in di.xml pointing to a named log file rather than the shared debug.log.
Stuck on a Magento 2 Issue?
CodeAtoZ provides Magento 2 debugging, performance auditing, and emergency support — we find the root cause, not just the symptom.